



Website redesign ROI is the simplest way to prove whether a new design will pay for itself. If you already have a website but it isn’t turning visitors into enquiries or sales, this guide shows the website redesign ROI math—and gives you a free calculator to run your exact numbers.
Why website redesign ROI matters for existing sites
- Traffic is expensive. You invest time, content, and ads to get visitors.
- Conversion is the multiplier. Lifting conversion from 1% → 3–5% can 3–5× results without buying more traffic.
- Good redesigns pay for themselves. A conversion-first refresh reduces friction, clarifies your offer, and builds trust—raising website redesign ROI fast.
The 4-Step Website Redesign ROI Formula
Revenue = Visitors × Conversion Rate × Average Sale × Close Rate × CLV
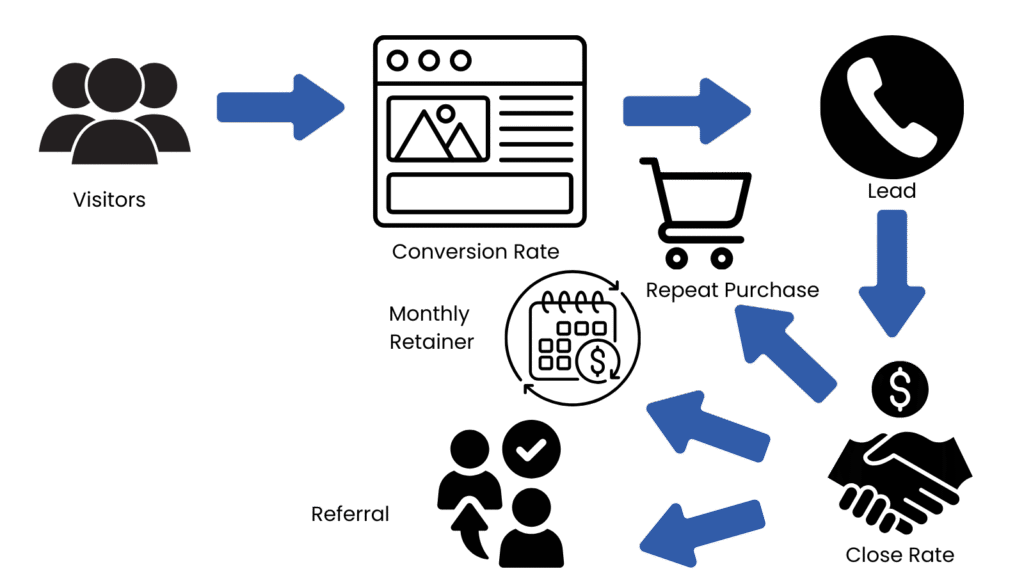
Think of website redesign ROI as answering four plain-English questions:
1) Traffic
How many visitors do you get per month? (If you’re unsure, model with 1,000 or 5,000 to start.)
2) Current vs target conversion
Most “average” sites convert ~1–2%. Well-optimised pages hit 5%+.
- At 1% →
Visitors × 0.01leads/customers - At 5% →
Visitors × 0.05leads/customers - Extra per month = the difference (this is the heart of your website redesign ROI)
3) Value of a lead or sale
What’s a customer worth on average? (Jobs, orders, project value.)
Optionally include:
- Close rate (% of leads that become customers)
- CLV multiplier (repeat purchases, retainers, referrals)
4) Stack the pain & show the fix
“Right now, you’re likely leaving $X,000/month on the table.
A redesign converts the traffic you already have—no extra ad spend required.”
That’s website redesign ROI in action.
Calculate your website redesign ROI (interactive)
Use the calculator below to see your upside in seconds:
Conversion Impact Calculator
Results
*Revenue uses Avg. Sale × (optional Close Rate/100) × (optional CLV Multiplier).
(If you’re on mobile and don’t see the calculator, rotate your device or open on desktop.)
How to read your calculator results
- Monthly vs annual: Multiply the monthly uplift by 12 for a realistic annual website redesign ROI forecast.
- Low traffic? Even small visitor numbers can pay when the average sale is high; prioritise conversion and proof first.
- Service vs e-com: Services often benefit from adding close rate and CLV in the calculator; e-commerce can start with AOV and storewide conversion, then refine by product/landing page.
Real-world examples
Example 1: Local Service Business (Plumber)
- Visitors: 1,000 / month
- Average job: $500
At 1%: 10 jobs → $5,000 / month
At 5%: 50 jobs → $25,000 / month
Lift: +$20,000 / month ($240,000 / year in potential website redesign ROI)
Even with a 40% close rate, the upside stays significant.
Example 2: E-commerce Store
- Visitors: 5,000 / month
- AOV: $80
At 1.2%: 60 orders → $4,800 / month
At 3%: 150 orders → $12,000 / month
Lift: +$7,200 / month (before email flows and CLV)
What actually moves the needle in a redesign
- What actually moves the needle in a redesign
- Message clarity above the fold: who it’s for, what you do, the outcome.
- Obvious CTAs: primary action in the hero and repeated down the page.
- Proof: reviews, client logos, case studies, guarantees, certifications. For research-backed usability principles, see Nielsen Norman Group (NN/g).
- Frictionless forms/checkout: fewer fields, mobile-first UX, no hidden surprises.
- Speed: fix Core Web Vitals (run your site through PageSpeed Insights) to reduce bounce.
- De-risking: pricing ranges, clear process, FAQs, timelines, warranties.
- Follow-up: lead magnets or abandoned-cart/quote recovery to salvage near-misses.
Common mistakes that depress website redesign ROI
- Pretty but unclear: aesthetic refresh with no value proposition or proof.
- CTA confusion: multiple competing actions or weak “learn more” buttons.
- Slow pages: heavy images, render-blocking scripts, or cheap hosting.
- Form friction: too many fields or poor mobile ergonomics.
- Missing trust signals: no testimonials, case studies, or guarantees.
How we implement website redesign ROI for clients
- Run the calculator with your current traffic and average sale.
- Quantify the gap between current and conservative target rates.
- Conversion-first roadmap:
- Weeks 1–2: quick wins (copy, headlines, CTAs, proof, speed)
- Weeks 3–5: redesign key funnels (home, services/product, contact/checkout)
- Ongoing: A/B tests and analytics to keep lifting results
- Track ROI monthly against the calculator’s projections and iterate.